Sunday, December 16, 2012

The Ballistic Pendumlum

Purpose:

To use the ballistic pendulum to determine the initial velocity of a projectile using conservation of momentum and conservation of energy.

Equipment:

Ballistic pendulum, carbon paper, meter stick, clamp, box, triple beam balance, plumb

Introduction:

In this experiment, a steel ball will be shot into the bob of a pendulum and the height (h) to which the pendulum bob moves, as shown in fig 1, will determine the initial velocity (V), of the bob after it receives the moving ball.

fig 1


If we equate the kinetic energy of the bob and ball at the bottom to the potential energy of the bob and ball at the height, h, that they are raised to, we get:
( K.E ) bottom = ( P.E)top
½ ( M + m ) V² = ( M + m ) g.h
 where M is the mass of the pendulum and m is the mass of the ball. Solving for V we get:
V  = √ 2gh            …………….  ( 1 )
Using conservation of momentum we know the momentum before impact (collision) should be the same as the momentum after impact. Therefore:
Pi = Pf
or
mv0 = ( M + m) V  …………… ( 2 )
where v0 is the initial velocity of the ball before impact. By using equations (1) and (2) we can therefore find the initial velocity, v0, of the ball.
We can also determine the initial velocity of the ball by shooting the ball as above but this time allowing the ball to miss the pendulum bob and travel horizontally under the influence of gravity. In this case we simply have a projectile problem where we can measure the distance traveled horizontally and vertically (see Figure 2) and then determine the initial velocity, v0, of the ball.

Fig 2 shows the procedure for letting the steel ball miss the pendulum and follow its projectile motion trajectory.

fig 2


Starting with equations:
∆x = voxt + ½axt²  ……………… ( 3 )
∆y = voyt + ½ayt2 ……………… ( 4 )

You should be able to derive the initial velocity of the ball in the horizontal direction (assuming that ∆x and ∆y are known). Include this derivation in your lab report.


Procedure, part one (determination of initial velocity using conservation of energy):

1) With the apparatus on the edge of the table and clamped down, make sure that the ballistic pendulum is level with the bubble level. In order to get the gun ready to be shot, pull back on the steel ball until the trigger is engaged. This will make sure the spring is compressed a known amount, therefore the ball will have an equal initial velocity each time it is fired.

2) Before firing, it is crucial to make sure the pendulum is at rest. Once it has stopped swinging, pull the trigger, and the ball will be shot into the pendulum and the combined masses will raise a definite height (h) and stop in a given notch.

3) Now shoot the steel ball into the cylinder nine times, and record the number of notches that the pendulum raises to each time. Taking the mean value of these nine trials will give us the average height (h) that the pendulum raised. Now take raise the pendulum bob to the notch that is the average value and take the measurements as pictured in fig 3.

fig 3
Taking our height to be the difference of 1 and 2 (i.e. 1-2), the average height in meters was 0.11 m, or 11 cm.

4) Carefully remove the pendulum from its support and weigh the masses of the pendulum, and the steel ball separately. Replace the pendulum and carefully adjust the thumb screw.
Pendulum mass = 0.2153 kg
Steel Ball mass = 0.0567kg

5) From this data, calculate initial velocity using equations one and two.


Using formula one to solve for final velocity, we obtain:
V  = √ 2gh           
V = (2 * 9.8 m/s2 * 0.11 m)1/2
V = 1.48 m/s

Plugging this value into equation two to solve for initial velocity, we get:
V0 = (MV/m) + V
V0 = (0.2153 kg * 1.48 m/s)/ 0.0567 kg + 1.48 m/s
V0 = 7.11 m/s


Procedure, part two (determination of initial velocity from measurements of range and fall):

1) Move the pendulum bob up on the rack so that it will not be in the path of the steel ball. Clamp the apparatus to the table and aim it out towards the floor. With one person watching to see where the ball strikes, this reference point is used to place the piece of carbon paper on the ground, which will aid in obtaining exact measurements.

2) Shooting the ball about 5 separate times, we can take the average distance that the ball traveled in measuring its trajectory. Pictured in fig 4 was the method that we had used to measure the horizontal distance traveled.

fig 4


 After taking the average, we can now calculate average initial velocity using equations 3 and 4.


∆x = voxt + ½axt²     where ax = 0, and ∆x = 2.91 m
2.91 m = voxt
2.91/vox  = t
Plug this into the equation for y

∆y = voyt + ½ayt2     where ∆y = -1.02 m, voy = 0, ay = -9.8 m/s2 , and t = 2.91/vox
-1.02 m = (1/2)(-9.8 m/s2)( 2.91/vox)2
Vox = (40.6)1/2
Vox = 6.37 m/s


3) Calculate the percentage difference between the results obtained in part one and part two.

percentage difference


Conclusion:

In completing The Ballistic Pendulum, one would be better able to understand how to determine the initial velocity of a projectile using the conservation of momentum and the conservation energy. I learned that we can determine, within a rough estimate, the average initial velocity of a projectile if both masses are known, or if its projectile path is measured. There were many potential sources of error in this lab which include the following:
1) There was friction present in the system as the pendulum bob swung upwards.
2) The steel ball had a varying initial velocity each time it was fired.
3) Certain distances may not have been measured in entire accuracy.
4) The spring loaded trigger may have been pulled back further for a trial or two.
An educated guess would be that part one would yield the more accurate result. Since the apparatus has a varying initial velocity each fire, part two would be less accurate in the fact that we had to measure large distances, and it may not have been so precise.


Wednesday, December 12, 2012

Inelastic Collisions

Purpose:

To analyze the motion of two low friction carts during an inelastic collision and verify that the law of conservation of linear momentum is obeyed.

Equipment:

Computer with logger pro software, lab pro, motion detector, horizontal track, two carts, 500 g masses (3), triple beam balance, bubble level

Introduction:

fig 1

In Fig 1 is the setup of the experiment. If we take the two carts to be an isolated system, then we can conclude momentum will be conserved. If the two carts experience a completely inelastic collision, then the law of conservation of momentum says:


Pi = Pf
m1v1 + m2v2 = (m1 + m2)V
Where v1 and v2 are the velocities of each cart before collision and V is the velocity of the combined mass after the collision.

Procedure:

1) Set up the apparatus as shown in fig 1. Use the bubble level to verify that track is level. Measure the mass of each object:
m1 = 0.5024 kg
m2 = 0.5134 kg

Connect the motion detector to the computer and open logger pro.

2) Check to make sure the motion detector is working properly by pressing collect then moving the cart nearest the detector back and forth. Does it provide a reasonable graph of position vs time?

Yes, as the cart is moved away from the detector, the functional value increases steadily, and as the cart is moved towards the detector, the functional value decreases. 

Position the carts so that their velcro pads are facing each other.

3) With the second cart (m2) at rest, give the first cart (m1) a gentle push away from the detector. Observe the position vs. time graph before and after the collision. Pictured in fig 2 is an educated guess as to what the position vs. time graph should look like.
fig 2

What should these graphs look like? 
The slope of the graph after the collision should be less than the slope of the graph after the collision. Pictured in fig 2 is my prediction of what the graph should look like.

The slope of the position vs. time graphs will give us our velocities directly before and after the collision. To avoid dealing with friction, we will find velocities at the instant before and after the collision. 

Is this a good approximation, why or why not?
Yes, because it will give us the instantaneous velocity directly before and after impact. 

Select a very small range of data directly before the collision and apply a linear fit to the range. Record the slope (velocity) of this line. Repeat for a small range of data points directly after the collision. 
v1 = 0.4171 m/s
V = 0.2305 m/s

Pictured in fig 3 is the position vs. time graph of one trial run we completed.

fig 3


4) Repeat for two more collisions. Calculate the momentum of the system the instant before and after the collision for each trial and find percent difference.

The folloing calculations are for the first trial in this part of the expirement.
Pi = Pf
m1v1 + m2v2 = (m1 + m2)V

where:
m1 = 0.5024 kg
m2 = 0.5134 kg

v1 = 0.4171 m/s
V = 0.2305 m/s

Pi = (0.5024 kg)( 0.4171 m/s) + (0.5134 kg)(0)
Pi = 0.21 kg m/s

Pf = (0.5024 kg + 0.5134 kg)(0.2305 m/s)
Pf = 0.23 kg m/s

Percent difference:
[(0.23 kg m/s - 0.21 kg m/s)/ 0.23 kg m/s]*100 = 10.5%

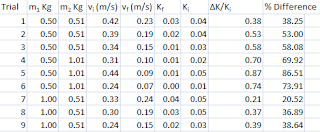
Pictured in fig 4 is data table of each trial and the momentum calculations

fig4
5) Add 500 g of mass to cart number 2 and repeat steps 3 and 4. 

m2 = 1.01 kg


Pictured in fig 5 is the data table for the additional mass on cart two.

fig 5
What do the graphs of velocity vs. time, and acceleration vs. time look like?
Pictured in fig 6 are my predictions of what velocity vs. time and acceleration vs. time should look like.

fig 6


6) remove the mass from cart two, and now add the mass to cart one.

m1 = 1.00 kg

Pictured in fig 7 is the data collected for the trials with mass added to cart one. 
fig 7


The average of all the percent differences that we had found was 10 % difference from the law of conservation of momentum. 

How well is the law obeyed based on the results of your experiment? 
The law of conservation of momentum was reasonably obeyed. Although we did encounter some larger percent differences, it may have been due to the range of data that was selected.

8) For each of the above nine trials, calculate the kinetic energy of the system before and after the collision. Find the percent kinetic energy lost during each collision. Show sample calculations here:


∆K/Ki * 100 = percent difference
[(Kf - Ki) /Ki ]*100
[(1/2*(m1 + m2)*V2 – ½* m1*v12)/ ½* m1*v12]*100
[((m1 + m2)*V2)/ m1*v12) – 1]*100
[((0.5024 kg + 0.5134 kg)* 0.23052 m/s)/ 0.5024 kg * 0.41712 m/s) – 1]*100 = 38 % difference

Pictured in fig 8 is the data showing the kinetic energy before and after collision, as well as the percent kinetic energy lost.
fig 8
9) Do theoretical calculations for ∆K/Ki * in a perfectly inelastic collision 

        1- a mass (m) colliding with an identical mass (m) initially at rest

Theoretical Calculation 1


        2- a mass (2m) colliding with a mass (m) initially at rest

Theoretical Calculation 2

        3- a mass (m) colliding with a mass (2m) initially at rest
Theoretical Calculation 3

Conclusion:

In completing this lab, one was able to analyze the motion of two low friction carts during an inelastic collision and verify momentum is conserved. I learned that if we can take a system where there are no outside forces acting within the system, the momentum will be conserved. Possible sources of error in this lab would include the following:
       1) Selecting a bad range of data from the position vs. time function, resulting in an inaccurate velocity value. 
       2) The carts may have taken a few milliseconds to actually stick together. 
       3) Friction was present in the system, resulting in a slight loss of momentum.
Further investigations that could be followed after this lab would be to determine the effect of the impulse on the momentum, or maybe even taking friction into account.


Balanced Torques and Center of Gravity

Purpose:

To investigate the conditions for rotational equilibrium of a rigid bar and to determine the center of gravity of a system of masses.

Equipment:

Meter stick, meter stick clamps (knife edge clamp), balance support, mass set, weight hangers, unknown masses, balance

Introduction:

The condition for rotational equilibrium is that the net torque on an object about a fixed point (C) is zero. Torque is defined as force times the lever arm length from the fixed center of gravity C. Pictured in Fig 1 is the concept of lever arm distance and force, as well as how torque is defined for this lab.

Fig 1


Procedure:

1) Balance the meter stick in the knife edge clamp. Pictured in Fig 2 are measurements that the meter stick was to found to have a net torque of 0.


Fig 2


Along with the center of gravity, the mass of the meter stick was measured.

without clamp:
mm = 0.0927 kg

with clamp:
mm = 0.1087 kg


What point in the meter stick does this correspond to?
This point corresponds to the meter stick's center of gravity, as it is perfectly balanced about a point 0.13 cm away from its center.


2) Now two masses of differing values were to be selected and placed at points of unequal lever arm distance in order to once again create a net torque of zero. Pictured in Fig 3 is the concept of how the masses were hung.
Fig 3


Is it necessary to include the mass of the clamps in your calculations?
Yes! It is crucial as they are also applying their own separate weight force to the meter stick in addition to the known mass we have added. These masses are critical to know in order to calculate the net torque accurately.


The masses that were hung in the system were recorded, along with the mass of the clamps.

m1 = 0.15035 kg
m2 = 0.1098 kg


Calculate the net torque


Net Torque = T1 - T2 = 0
x1m1g - x2m2g = 0
(0.299 m )(0. 15035 kg)(9.8 m/s2) – (0.401 m)( 0.1098 kg)( 9.8 m/s2) = 0
0.51- 0.51 = 0

This value matches entirely with the expected value of net torque

3) Now, a third mass of known value is added to the right of our meter stick. placing all the masses at different locations again, we once again search for the point where net torque = 0.

Pictured in fig 4 is the conceptual representation of the three masses at equilibrium.

fig 4


m1 = 0.15035 kg
m2 = 0.1098 kg
m3 = 0.1236 kg
Net Torque = T1 - T2 – T3 = 0
x1m1g - x2m2g - x3m3g = 0
(0.4 m)( 0.15035 kg)( 9.8 m/s2) – (0.224 m)( 0.1098 kg)( 9.8 m/s2) –(0.3224 m)( 0.1236 kg)( 9.8 m/s2) =0
0.59- 0.63= -0.04


The value of 0.04 was off from the expected value of 0 by 4%

4) In this step, mass one was replaced with a mass of unknown value. Pictured in fig 5 is how this step is performed.


fig 5


Calculate the unknown mass using the condition for rotational equilibrium.


m1 = unknown
m2 = 0.1098 kg
m3 = 0.1236 kg
Net Torque = T1 - T2 – T3 = 0
x1m1g - x2m2g - x3m3g = 0
(0.407 m)( m1)( 9.8 m/s2) – (0.224 m)( 0.1098 kg)( 9.8 m/s2) –(0.3224 m)( 0.1236 kg)( 9.8 m/s2) =0
m1 = [(0.224 m)( 0.1098 kg)( 9.8 m/s2) +(0.3224 m)( 0.1236 kg)( 9.8 m/s2)] / [(0.407 m)(9.8 m/s2)]
m1 = 0.158 kg


Weighing the unknown mass on the scale, it was found to be 165.1 g or 0.1651 kg. Our calculated value differed from the measured value by the following:
[(165.1-158)/165.1]*100= 4.3% difference

5) In this step, only one mass of 200 g is hung at the 90 cm mark on the meter stick. Adjusting the position of the meter stick in its knife edge clamp, it is once again balanced. Calculate the mass of the stick.

Pictured in fig 6 is how the meter stick was balanced at a given point with a mass hanging from the 90 cm mark.
fig 6

m1 = 0.2167 kg
Net Torque = Tg - T1 = 0
xmmmg - x1m1g = 0
0.282mmg – 0.12*0.2167*g = 0
0.282mm = 0.12*0.2167
mm = 0.0922 kg


Should the mass of the clamp be included as part of the mass of the meter stick?
No, in this case it would only add further error to our calculations. The stick here is not affected by the clamp's mass, it is simply balancing about that point. Only the mass of the stick itself need to be taken into account in order to calculate the center of gravity's influence on torque.

Since the mass of the meter stick was found to be 0.0927 kg without the clamp, we calculate the difference.

[(0.927-0.0922)/0.0927]*100 = 0.65% difference

6) With the added mass still at the 90 cm mark, imagine that an additional 100 g is placed at the 30 cm mark on the meter stick. Calculate the position of the center of mass of this combination of masses and lever arm distances.

Pictured in fig 7 is how the center of gravity can be found using the net torque formula and a lot of algebra.

fig 7
Based on our given masses and meter stick, our center of mass should be close to the 60.8 cm mark on the meter stick.

Actually performing this experiment with the meter stick we were given, we found that the actual center of mass of the system was at the 61.1 cm mark. The percent difference is calculated as follows:


Percent difference = |(actual – measured)/ actual|*100
|(61.1 – 60.8)/ 61.1|*100 = 0.5% difference

Conclusion:

Upon completion of the lab, one obtained a better understanding of rotational torque and center of gravity. The points of equilibrium in rotational torque were able to be analyzed in multiple contexts. There were a few minor sources of error in this lab:
1) We may have miscalculated our actual center of gravity by a few millimeters.
2) The measurements of the lever arms of each weight may have been measured slightly wrong.
Overall, the measurements and calculations made in this lab seemed to be very accurate. The concept of rotational equilibrium was entirely supported by our tests.


Tuesday, December 11, 2012

Human Power


Purpose:

The purpose of Human Power was simply to determine how much power is used when a person walks up a flight of stairs.

Introduction:

Power is defined to be the rate at which work is done:

Power = (∆PE) / (∆t)
Where ∆PE = change in potential energy, and ∆t = time to climb

In this experiment, we will climb up two flights of stairs, and time the trip up. In measuring the height of the stairs, and measuring our mass (kg), the change in gravitational potential energy can be evaluated:

∆PE = mgh
Where ∆PE = change in potential energy, m = mass, g = acceleration of gravity, and h = vertical height climbed

Procedure:

1)      Determine your mass by weighing yourself on the bathroom scale. The scale read in Newtons and read 636 N, so the mass had to be solved for:
Fw = 636 N
636 N = ma  à where a = g
636 N/ 9.8 m/s2 = m
m = 64.9 Kg

2)      Next, the height of the stairwell that we were to climb needed to be measured. Two measuring sticks (each 2 m in length) were taken to the stairwell and placed directly on top of each other. The stairwell was measured to be 4.29 m. In fig 1, the method of measurement is pictured:
fig 1


3)      This is when the actual trials for every one take place. At the command of the timer, one person waits to begin their short trip up the stairs, and then the timer stops the watch once they reach the top of the stairs.


4)      The trial runs for every person are repeated, as we can have two separate times to do calculations with.


5)      From the two trials runs up the stairs, the individual times were t1 = 6.13 s and t2 = 6.68 s. Calculate the personal power output.
Taking the first time, the change in potential energy is evaluated as follows:
∆PE = mgh
∆PE = (64.9 kg)*(9.8 m/s2)*(4.29 m )
∆PE = 2728.5 Nm
Power (W) = (∆PE)/( ∆t)
Power (W) = 2728.5 Nm / 6.13 s
Power (W) = 445.1 W
hp = 445.1W (0.00134102209 hp / 1 W)
= 0.60 hp
Pictured in fig 2 is the data collected from the trial runs. The average power output for the two trials was calculated to be 0.57 hp.

fig 2
6) The average power output of the entire class was then evaluated in one excel spreadsheet. Pictured in fig 3 is the data collected from the entire class.

fig 3

Conclusion:

In performing the lab, one was able to determine the average power output of a person walking or running up the stairs based on the person's mass and how far they had climbed in what time. I learned that although the process and way in which energy is utilized to move up a flight of stairs can be complex, a simpler model of the energy expended can be obtained if we take the motion to be vertical only. The sources of error in the human power lab included the following:
1) The motion was not exactly vertical, we had to run horizontally as well as vertically in order to get up the stairs.
2) There was a roundabout in the middle of the staircase that needed to be swung around.

Questions:
1)      Is it okay to use your hands and arms on the handrail to assist you in your climb up the stairs?
Yes, although you are using multiple limbs in order to make your way up the stairs, there is still work being expended to get to the top. More energy is exerted in pulling yourself up for a faster time.

2)      Discuss some of the problems with the accuracy of this experiment.
-          -Actual times of travel may be rough estimates as we could not see the timer before we started.
-         - We were not just traversing vertically, we were also propelling our bodies horizontally, which we did not account for.
-         - There was a turn that had to be swung around in the middle of the stairwell.

Human Power Follow-Up Questions:
1)      Since the change in potential energy is the same for both people, the person who completes the journey in the fastest time will expend the most energy. Since power output is change in potential energy over change in time, we can see the smaller the time, the greater the power output.

2)      mg = 1000 N
h = 20 m
t = 10 s

Power (W) = (∆PE)/( ∆t)
Power(W) = (1000 N * 20 m ) / (10 s)
Power (W) = 2000W, or 2 KW
  3)      Brynhildur climbs up a ladder to a height of 5.0 m, if she is 64 kg:
a)      What work does she do?
The work that Brynhildur does climbing up the stairs is lifting her 64 kg mass up to a height of 5 meters.

b)      What is the increase in gravitational potential energy of the person at this height?
∆PE = mgh
∆PE = 64 kg * 9.8 m/s2 * 5.0 m
∆PE = 3136 N m
c)      Where does the energy come from to cause this increase in PE?
The energy required to lift her up the ladder comes from her muscles both pulling and pushing her way up the ladder.

4)      Which requires more work: lifting a 50 kg box vertically for 2 m, or lifting a 25 kg box 4 m?
  They require the same amount of work, although the 25 kg mass is being lifted to twice the height, the 50 kg mass is being lifted to a height half the amount, meaning it takes the same amount of work.

Saturday, December 8, 2012

Motion in One Dimension with Air Drag


Purpose: 

The purpose of Motion in One Dimension with Air Drag is to analyze how a changing force will affect motion in one dimension.

Introduction: 

Up to this point in the class, we have only discussed problems that involve constant forces. But what happens if a changing force is applied to an object (e.g. a force that has a changing magnitude over time)? This would affect the acceleration that the object was experiencing, it would begin at an initial value and the function would gently reach a=0 once terminal velocity is reached. Calculus provides a method to determine the way in which the acceleration and velocity of the object are changing. In this lab a spreadsheet will be used to calculate these changing values. Two basic relationships can be used to analyze the object:
Vnew = Vold + aavg * ∆t
Where Vold = previous value of velocity, aavg = value of acceleration at the midpoint of the time interval

1)      Using unit analysis, the above equation is verified:
(m/s) = (m/s) + (m/s^2)*(s)
(m/s) = (m/s) + (m/s)
(m/s) = (m/s)

2)      Why do we use aavg in equation 1?

The Since the acceleration is changing at every moment in time, we calculate the value of our acceleration in the average of the time interval for every ∆t.

3)      Come up with an analogous equation relating ynew to yold.

ynew = yold + vavg*(∆t) + (aavg/2)*( ∆t^2)
or
ynew = yold + vavg(∆t)

4)      What is the benefit of choosing a small ∆t?

The smaller the value of the time interval we choose for ∆t, the less dramatic the overall change in acceleration during that time interval will be, resulting in an estimated value much closer to the actual value.

Because acceleration s the result of all forces acting on the object, all forces need to be specified. In this problem, the drag force will be assumed to be the first power of the velocity and can be written as:
FD = -kv
Where k is a proportionality constant

1)      Draw a detailed motion diagram for the object falling down. Pictured in fig 1 is the motion diagram of an object experiencing an increasing drag force.
fig 1


a)      Pictured in fig 2 is the force diagram of the object, assuming terminal velocity was reached.

fig 2

      From Newton’s Second Law, it is known that an object of mass (m), will undergo acceleration as a result of the sum of all forces acting on the object.
Fnet = m*a
Where:
Fnet = FD – FW
m*a = (-kv) – (m*g)

Solve for acceleration:

a = ((-kv)-(m*g))/m

b)      Taking into consideration that we are looking at terminal velocity, let vt = terminal velocity, and take a = 0. Solve for k:

0 = ((-kvt)-(m*g))/m
0 = (-kvt)-(m*g)
(-kvt) = (m*g)
k = -((m*g)/ vt

c)      Substitute this value for k back into the expression for Newton’s Second Law:

a = ((-(-((m*g)/ vt )*v)-(m*g))/m
a = m*(((g/ vt )v)-g)/m
a = (((g/ vt )v)-g)
a = g*((v / vt )-1)   or equivalently,
a = -g*(1- (v / vt ))

2)      Next, open the file entitled Air Drag. Describe what the Spreadsheet is calculating.

a)      What are the initial values that are assumed in the spreadsheet?
y0 = 1000 m
v0 = 20 m/s
a0 = -14.7 m/s2
b)      What is v – halfstep?

v – halfstep is the velocity calculated in the average of the time interval ∆t.

c)      What is a – halfstep?

a – halfstep is the acceleration calculated in the average of the time interval ∆t.

3)      Draw graphs of position vs. time, velocity vs. time, and acceleration vs. time for the object assuming no air drag. Pictured in fig 3 are the estimates of the position, velocity, and acceleration vs. time graphs.

fig 3


Now assume air drag and draw estimates of what the graphs would look like. Pictured in fig 4 are my personal estimates of what the same graphs would look like if the object was also experiencing an increasing force, opposite the direction of motion.

fig 4


4)      Create graphs in the graphical analysis software by selecting the data ranges we have calculated. Compare the predicted graphs to the graphs made in the graphical analysis software. How are they similar, how are they different? Pictured in fig 5-7 are the acceleration vs. time, velocity vs. time, and position vs. time functions of the object undergoing drag force -kv.
fig 5
fig 6

fig 7


The graphs that were predicted were fairly accurate. The Position vs. time graph starts off parabolic but it eventually reaches a constant slope, therefore a constant speed. The velocity vs. time graph starts off positive and it decreases in speed, changes direction, then its slope increases to zero, meaning its acceleration tapers off to zero. The object has an initial acceleration but, as drag increases, the value of acceleration heads to zero.

a)      If a = -g*(1- (v / vt )) when FD = -kv, predict what the acceleration will look like if   FD = kv2

Fnet = FD – FW
m*a = (kv2) – (m*g)

a = (kv2)/m – (m*g)/m

assume terminal velocity (a=0)

0 = (kvt2)/m – (m*g)/m
0 = kvt2 – mg
kvt2 = mg
k = (mg)/(vt2)

plug it back into acceleration equation

a = (((mg)/(vt2))*v2)/m – (m*g)/m
a = ((mg)/(vt2))*v2) – (m*g)
a = m*((g/vt2)*v2 – g)

assuming terminal velocity

0 = m*((g/vt2)*v2 – g)
0 = (g/vt2)*v2 – g
0 = g*(v2 /vt2 – 1)

Therefore

a = g*(v2 /vt2 – 1)

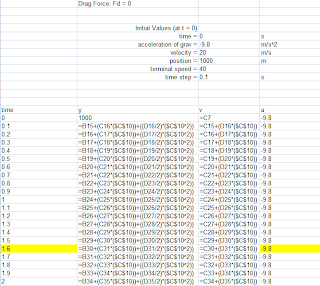
5)       After copying the spreadsheet, it was modified. The acceleration was changed to the new formula for |kv^2|. Pictured below are the spreadsheets with formulas and data for a drag force = 0, Drag force  = -kv, and drag force = |kv^2|.


Fig 9
(fd = 0 spreadsheet data)
Fig 8
(fd = 0 spreadsheet formulas)


Fig 10
(fd = -kv spreadsheet data)
Fig 11
(fd  = -kv formulas)


Fig 12
fd = |kv^2| data


Fig 13
fd = |kv^2| formulas


6) Taking the time to be the independent values, and the position or y value to the independent variable, graphs of all three drag forces were plotted on one graph. Pictured in Fig 14 are the position vs. time graph of fd = 0, fd = -kv, and fd = |kv^2|.

Fig 14

In addition, the velocity vs. time graphs of all three drag forces were also to be plotted. Pictured in Fig 15 are the velocity vs time graphs for all 3 drag forces.


Fig 15

In analyzing drag forces that had varying degrees of intensity, one can now make a reasonable assumption about how a changing force will effect the motion of an object. If an object experiences a constant force, and thus constant acceleration, the velocity will continue to change in a linear fashion with the slope equal to its acceleration. If there is a force that is proportional to the speed of an object opposing motion, the acceleration will have some initial value, and gently approach zero. The velocity of this object will continue to increase until the object no longer accelerates at which point terminal velocity was reached in this lab. The position function will start off parabolic with the slope gradually becoming linear. The main source of error in this lab would be entering formulas into excel incorrectly. Our group had a few issues with getting the numbers to match with the values as they would be expected.